CSIT_Labs
Regression Analysis
Steps
for example of data set:
Qn) A developer of food for pig wish to determine what relationship exists among ‘age of a pig’ when it starts receiving a newly developed food supplement, the inital weight of the pig and the amount of weight it gains in a week period with the food supplement. The following information is the result of study of eight piglets.
| Piglet number |
Initial weight (pounds) |
Initial age (weeks) |
Weight gain |
|---|---|---|---|
| 1 | 39 | 8 | 7 |
| 2 | 52 | 6 | 6 |
| 3 | 49 | 7 | 8 |
| 4 | 46 | 12 | 10 |
| 5 | 61 | 9 | 9 |
| 6 | 35 | 6 | 5 |
| 7 | 25 | 7 | 3 |
| 8 | 55 | 4 | 4 |
- Determine the least square equation that best describes these three variables.
- Calculate the standard error.
- How much gain in weight of a pig in a week can we expect with the food supplement if it were 9 weeks old and weighed 48 pounds?
- Test the significance of the regression coefficients abd overall fit of the regression equation.
- Conduct the residual analysis.
- Determine partial correlations, multiple correlation and coefficient of multiple determination. Interpret.
-
Goto variable view and add the variables
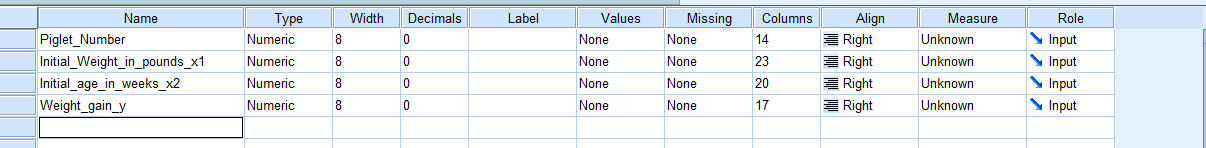
-
Goto data view and add the given data.
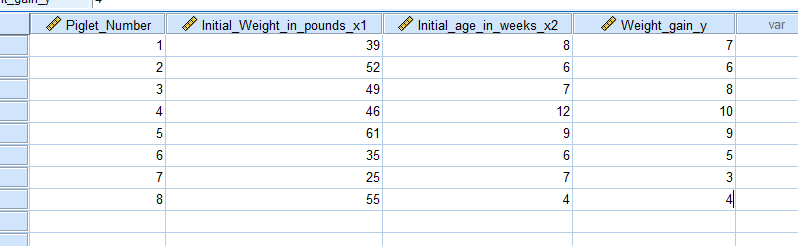
-
Click on Analyze tab > Regression > Linear.
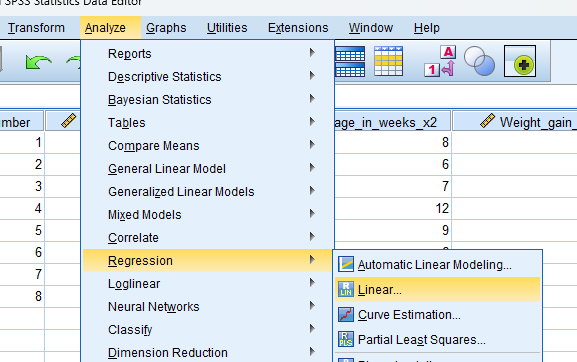
-
Add the dependent variable in Dependent and independent variable in Independent(s). Then click Statistics.
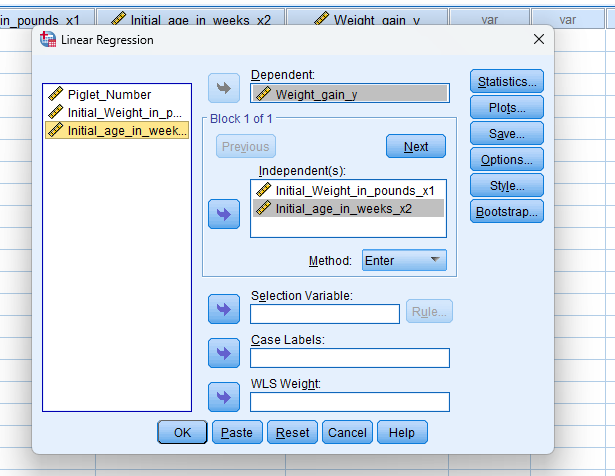
-
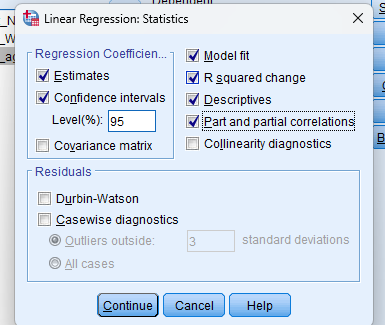
Tick Estimates, Confidence Intervals, Model fit, R squared change, Descriptives, Part and partial correlations and then Continue.
-
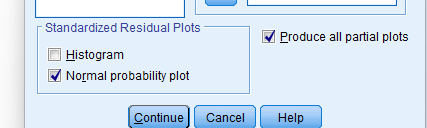
Click Produce all partial plots and Continue.
-
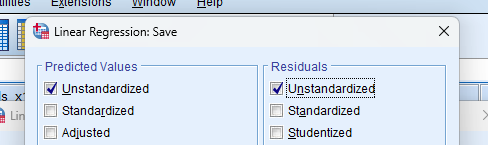
Click Unstandarized in both tabs and Continue.
-
Required Output:
Output to open in SPSS.